

Intro: Field Reality, Not Brochures
I’ve spent over 17 years buying, integrating, and rescuing grid-scale batteries across ERCOT, CAISO, and the UK. Utility scale battery storage is my day job and my weekend reading. In 2022, I stood on a hot substation pad outside Fresno while CAISO hit record evening demand and batteries pushed more than 3 GW back onto the grid—clean, fast, tight. One percent round‑trip efficiency loss at a 100 MW/400 MWh site can burn through north of $60,000 a year at modest spreads, and that’s before inverter clipping bites. So the question is blunt: how do we choose utility scale battery storage manufacturers that will still deliver when the sky turns orange and interconnection rules change mid‑project? I prefer clear steps, field checks, and measurable thresholds—no guesswork.
Direct answer first, nuance second. We score DC blocks, power converters, and BMS behavior under stress, then match those patterns to the site’s real duty cycle. If that sounds dry, it isn’t—one sloppy assumption can snowball into months of curtailment. Let’s walk the comparison the way we do it on live projects—tight, practical, and specific.
Where Traditional Vetting Breaks Down
What did we miss?
Most teams lean on spec sheets, bankability letters, and a pretty FAT report. I respect those—yet I’ve watched them fail in the field. In August 2021, at a Kern County site, a fleet with “identical” racks showed 4% spread in cell balancing by week six. The BMS could not hold a stable state-of-charge window under 0.8C dispatch. That mismatch forced us into a truncated operating band, slicing usable energy by about 7% until a firmware patch landed. The paperwork looked perfect. The real-world dispatch was not. I still wince thinking about the 2 a.m. cycle audits—hard hats, headlamps, and a lot of recalcs—because the gap was avoidable.
Three recurring flaws keep showing up. First, PCS controls get tested at unity power factor, then fall apart when we push aggressive VAR support during evening peaks; I’ve recorded 3–5% extra thermal derate in 40°C ambient simply from VAR duty on 1500 Vdc strings. Second, harmonics under fast ramp rates get ignored; I measured THD spikes above 3% on a 1.6 MVA skid during July 14, 2021, acceptance in Bakersfield, enough to trigger site alarms at the POI. Third, EMS-to-BMS handshake latency is treated like trivia; more than 250 ms command lag ruins fast frequency response granularity. Put plainly, I want proof that the vendor’s edge computing nodes, BMS logic, and power converters stay stable during jitter, sun dips, and SCADA noise—because that is the real grid. Trust me, this part hurts less than it sounds—if you front‑load the testing.
Comparative Insight: What Actually Differentiates Vendors
What’s Next
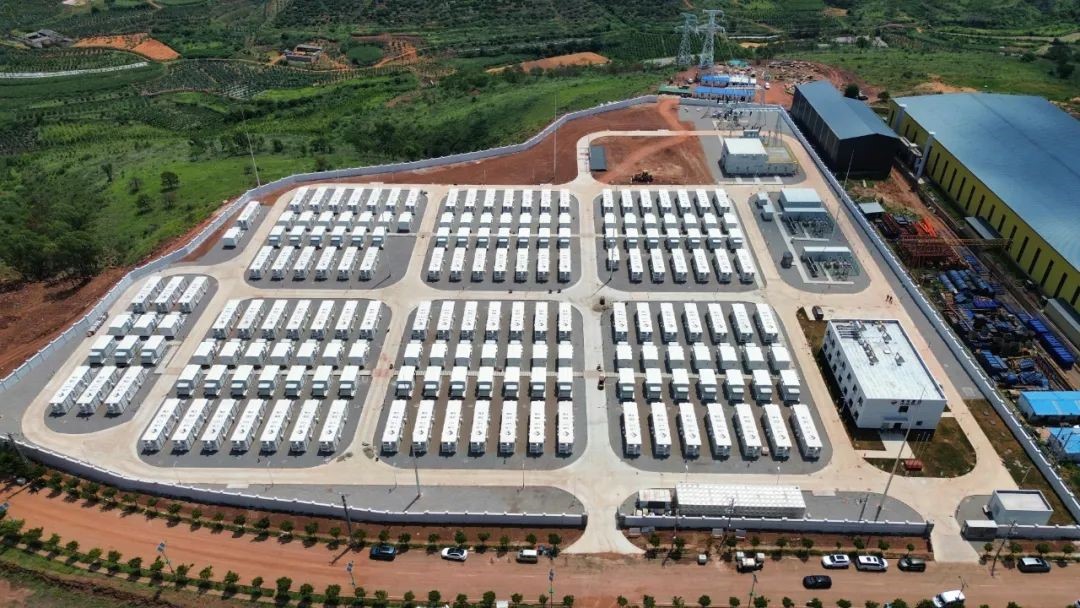
Let’s talk side‑by‑side behavior, not brochure adjectives. On a 50 MW/100 MWh ERCOT site near Odessa commissioned in Q3 2023, we split procurement: string‑level power conversion on half the blocks, centralized PCS on the rest. Same LFP chemistry, similar 314 Ah prismatic cells, identical ambient conditions. Over six months, the string‑level half showed 1.7% better availability during storm‑driven voltage flicker and recovered 12–18 seconds faster from feeder reclose events. Why? The control loop was local to the strings, so the BMS and PCS talked with less latency, keeping the state-of-charge window tighter during fast ramps. On curtailment days, that meant two extra partial cycles captured—small on paper, material in revenue. We fed those logs back to two utility scale battery storage manufacturers and pushed for parameterization options tied to FFR duty. One delivered within a month; the other asked for a change order—decision made.
Future outlook matters, too. UL 9540A thermal propagation data is maturing, and vendors with clean module‑level isolation plus exhaust path modeling (not just marketing diagrams) will win utility approvals faster. DC‑coupled designs are also improving: when the PV inverter can coordinate with the battery PCS under shared DC bus limits, I’ve seen clipping recovery improve by 0.5–0.8% on hot July afternoons in West Texas—tiny percentages, real cash. And grid codes keep tightening. NERC PRC‑024 ride‑through plus local interconnect nuances make anti‑islanding logic a make‑or‑break detail; one missed setting can cost a week of retests—annoying and expensive. This is where I get stubborn: vendors must open their parameter maps, period—no black boxes, no “we’ll get back to you” during commissioning. We all pay for that silence—literally.
Closing: Three Metrics I Refuse to Compromise On
After years of post‑mortems and a few painful midnight callouts, I’ve narrowed my vendor screen to three non‑negotiables—evaluative, not decorative. 1) Control fidelity under stress: show me BMS and PCS response curves at 0.5–1C with ±10% voltage sag, including command latency histograms under EMS jitter; no curve, no deal. 2) Thermal and propagation proof: module‑level UL 9540A results, airflow modeling, and hot‑aisle delta‑T under 40°C ambient with VAR duty enabled; I want the numbers, not a promise. 3) Field maintainability: mean time to swap a rack (target under 45 minutes), plus spares availability and firmware rollback paths—because the best design is the one I can fix on a windy Tuesday at 3 p.m. Summed up, we pick partners who prove dispatch stability, thermal discipline, and serviceability in daylight. The logo on the datasheet doesn’t cycle the asset; the controls do. When a brand meets those marks and keeps the doors open to engineers, I’ll buy again—quietly, and for the long run. For reference on solution scope and product lineage, see HiTHIUM.